

The coronavirus pandemic is on everyone’s mind right now: where are we seeing spikes, which populations are most vulnerable, how can we contain the spread. Infectious disease outbreaks are spatial in nature and the key to preventing the spread is close monitoring and timely investigation. Each state requires certain diseases be reported, both confirmed and probable cases, and those cases are then reported to the CDC.
One of the initial steps in monitoring and investigating an outbreak is collecting data on individual cases using a disease surveillance worksheet. The CDC offers sample surveillance worksheets and many state and local health departments utilize these or similar paper forms. A vast amount of information can be captured on such a worksheet but using a paper-based form has substantial shortcomings. First, collecting via paper worksheet introduces human error and non-standard or illegible entries. You are also limited in the type of information that can be collected such as images, audio, and video. Manually collected information must later be transferred to digital form, which takes more time, increases likelihood of error and delays availability of the data, which is especially problematic when agencies are attempting to respond rapidly and take appropriate measures to control a potential outbreak. Here at DVG we looked at this workflow to see where we could streamline the process using “out of the box” GIS tools, using measles as an example. Our goal with this demonstration was to build a field survey and a real-time dashboard in a couple of working days.
A Better Way
It is time to ditch the paper and clipboard for a complete digital solution. At DVG, we have experience developing surveys with Survey123, part of the Esri Platform that many agencies already have and are familiar with. With Survey123, you can create smart forms with an array of options and configurations that make for a straightforward user experience.
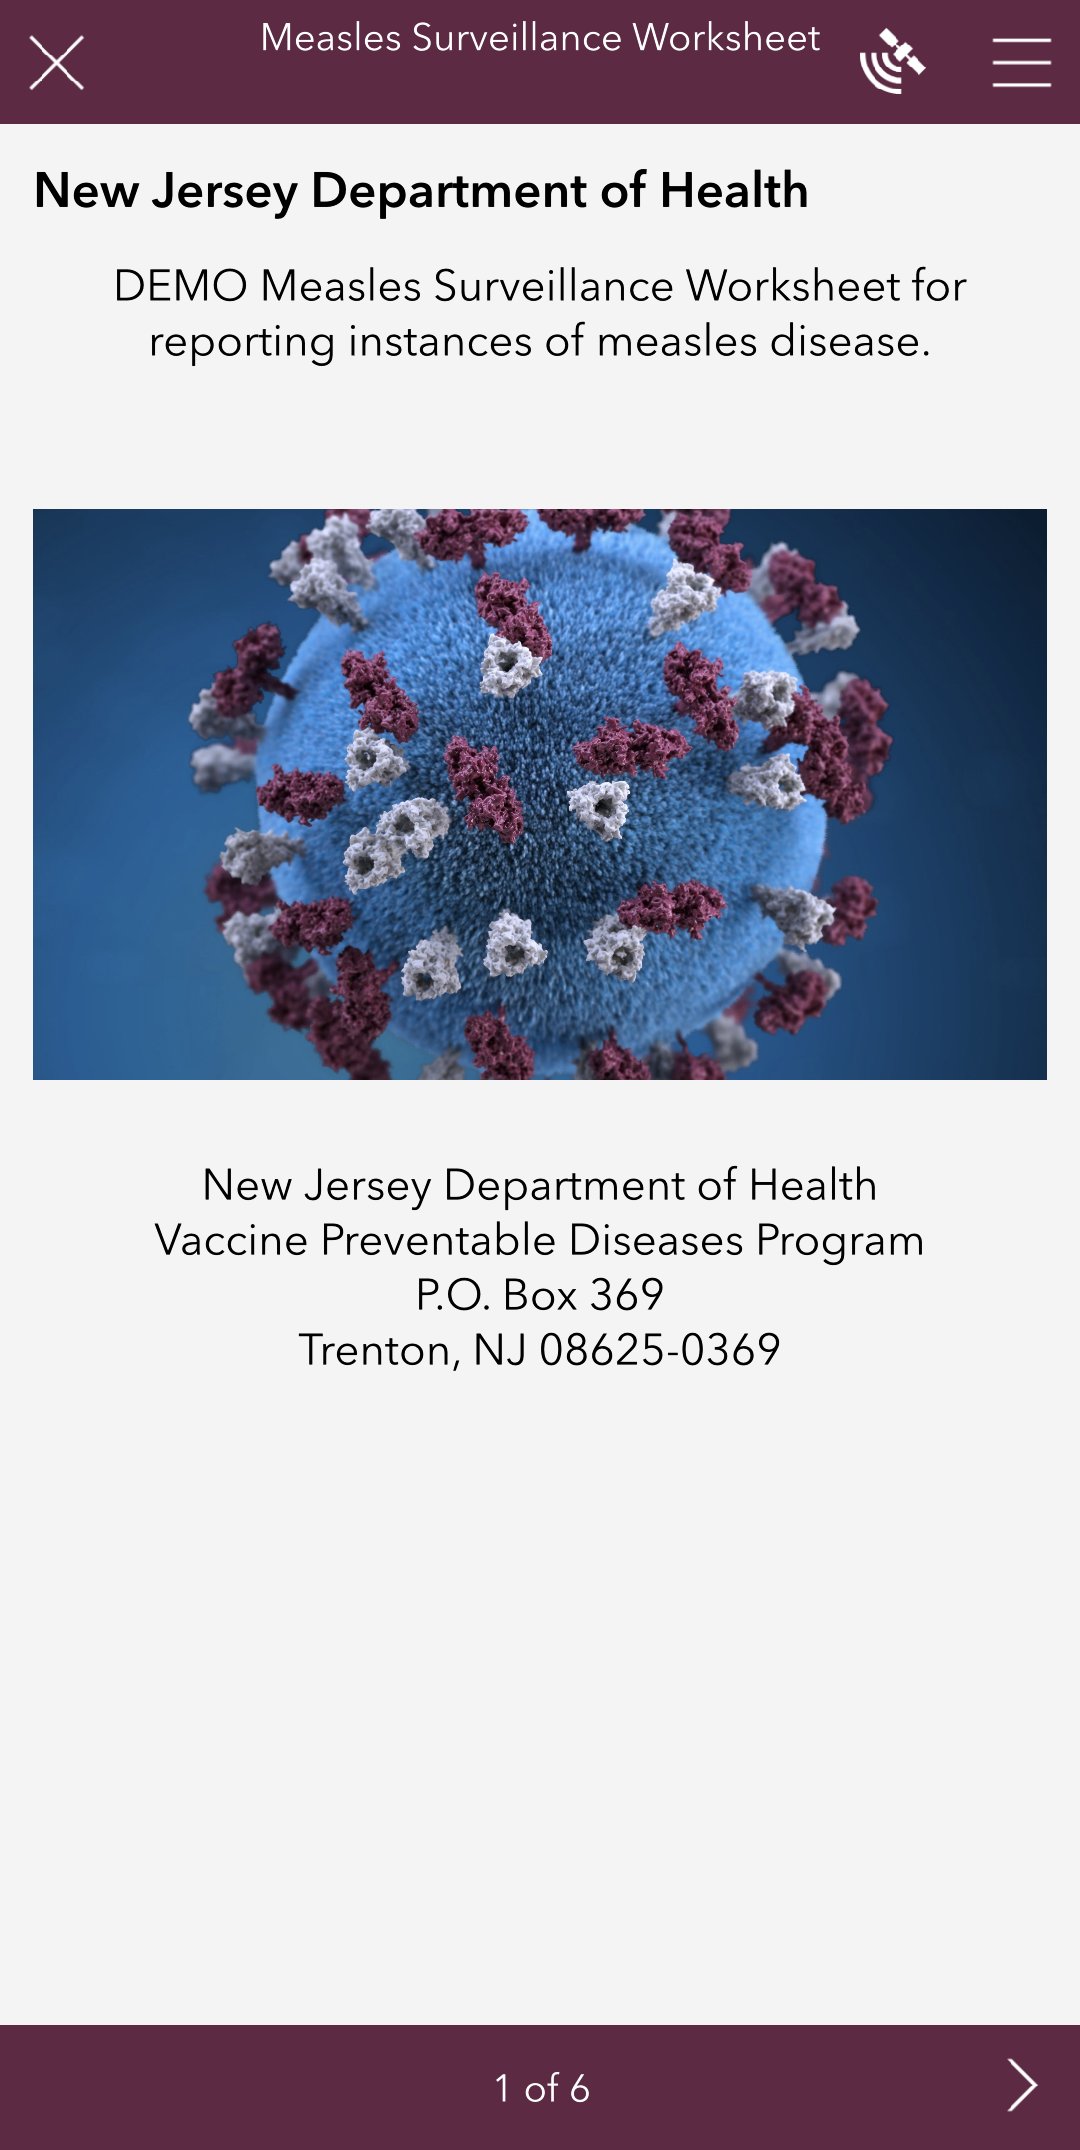
While the coronavirus has our attention currently, it is not the only disease outbreak that our country has faced recently. In 2019, the US saw the highest number of measles cases in over 25 years. For this demonstration we use measles as a prototype for disease surveillance. We developed a digital version of New Jersey’s Measles Surveillance Worksheet* using Survey123, transposing each of the questions into a smart form with configurations that ensure the collection of standardized and valuable information:
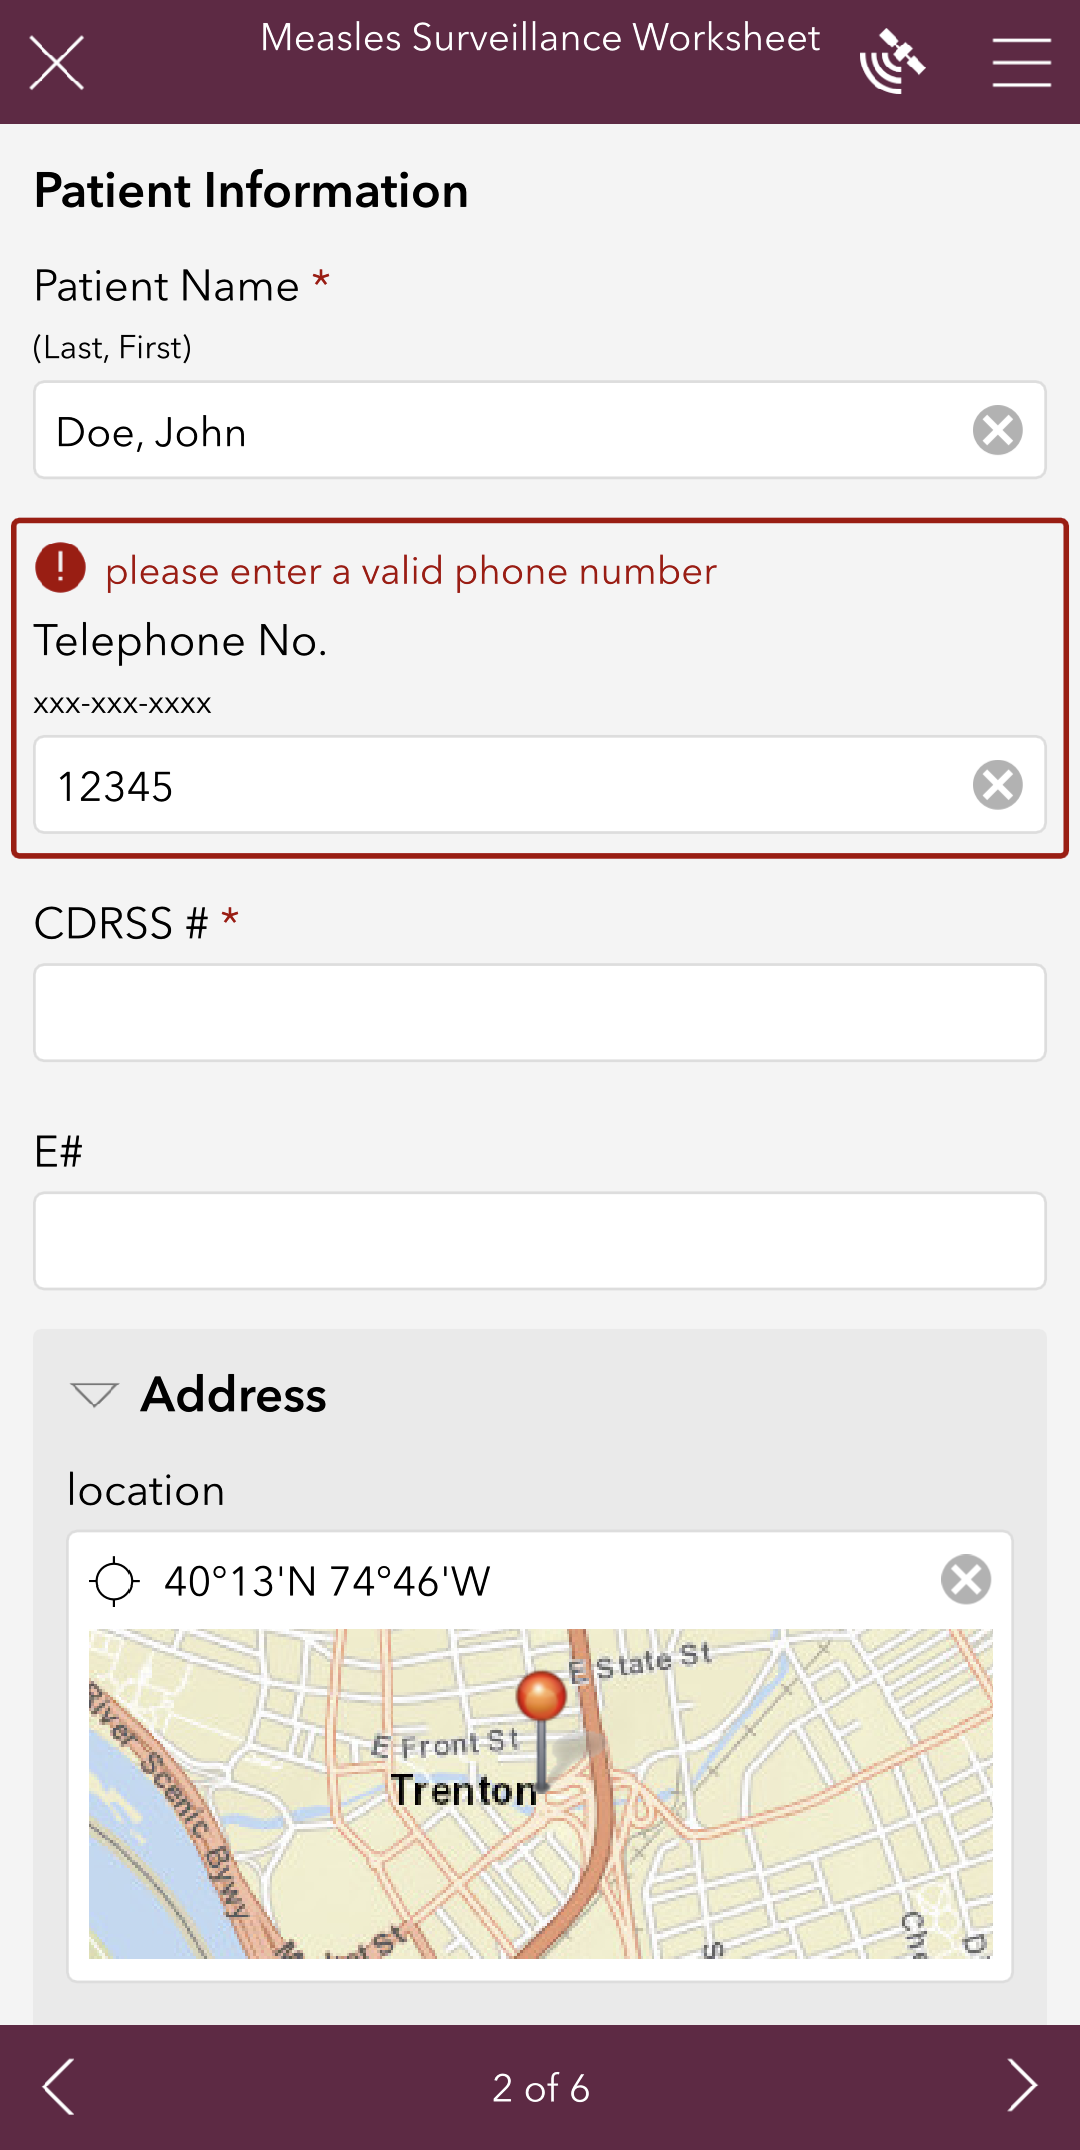
- The survey was developed using various question types that, such as text entry, number entry, single-choice, multiple-choice, dropdowns, date, and location, among other options.
- The questions have been configured with input constraints and validation to ensure entries conform to an expected response. The phone number questions only accept an input in the 555-555-5555 format. The Date of Birth question only accepts a date that occurred in the past.
- The survey is configured with a calculation to determine and pre-populate the patient’s age based on the date of birth that was entered.
- Certain questions are designated as required, prompting the user and preventing the survey to be submitted until a response is provided.
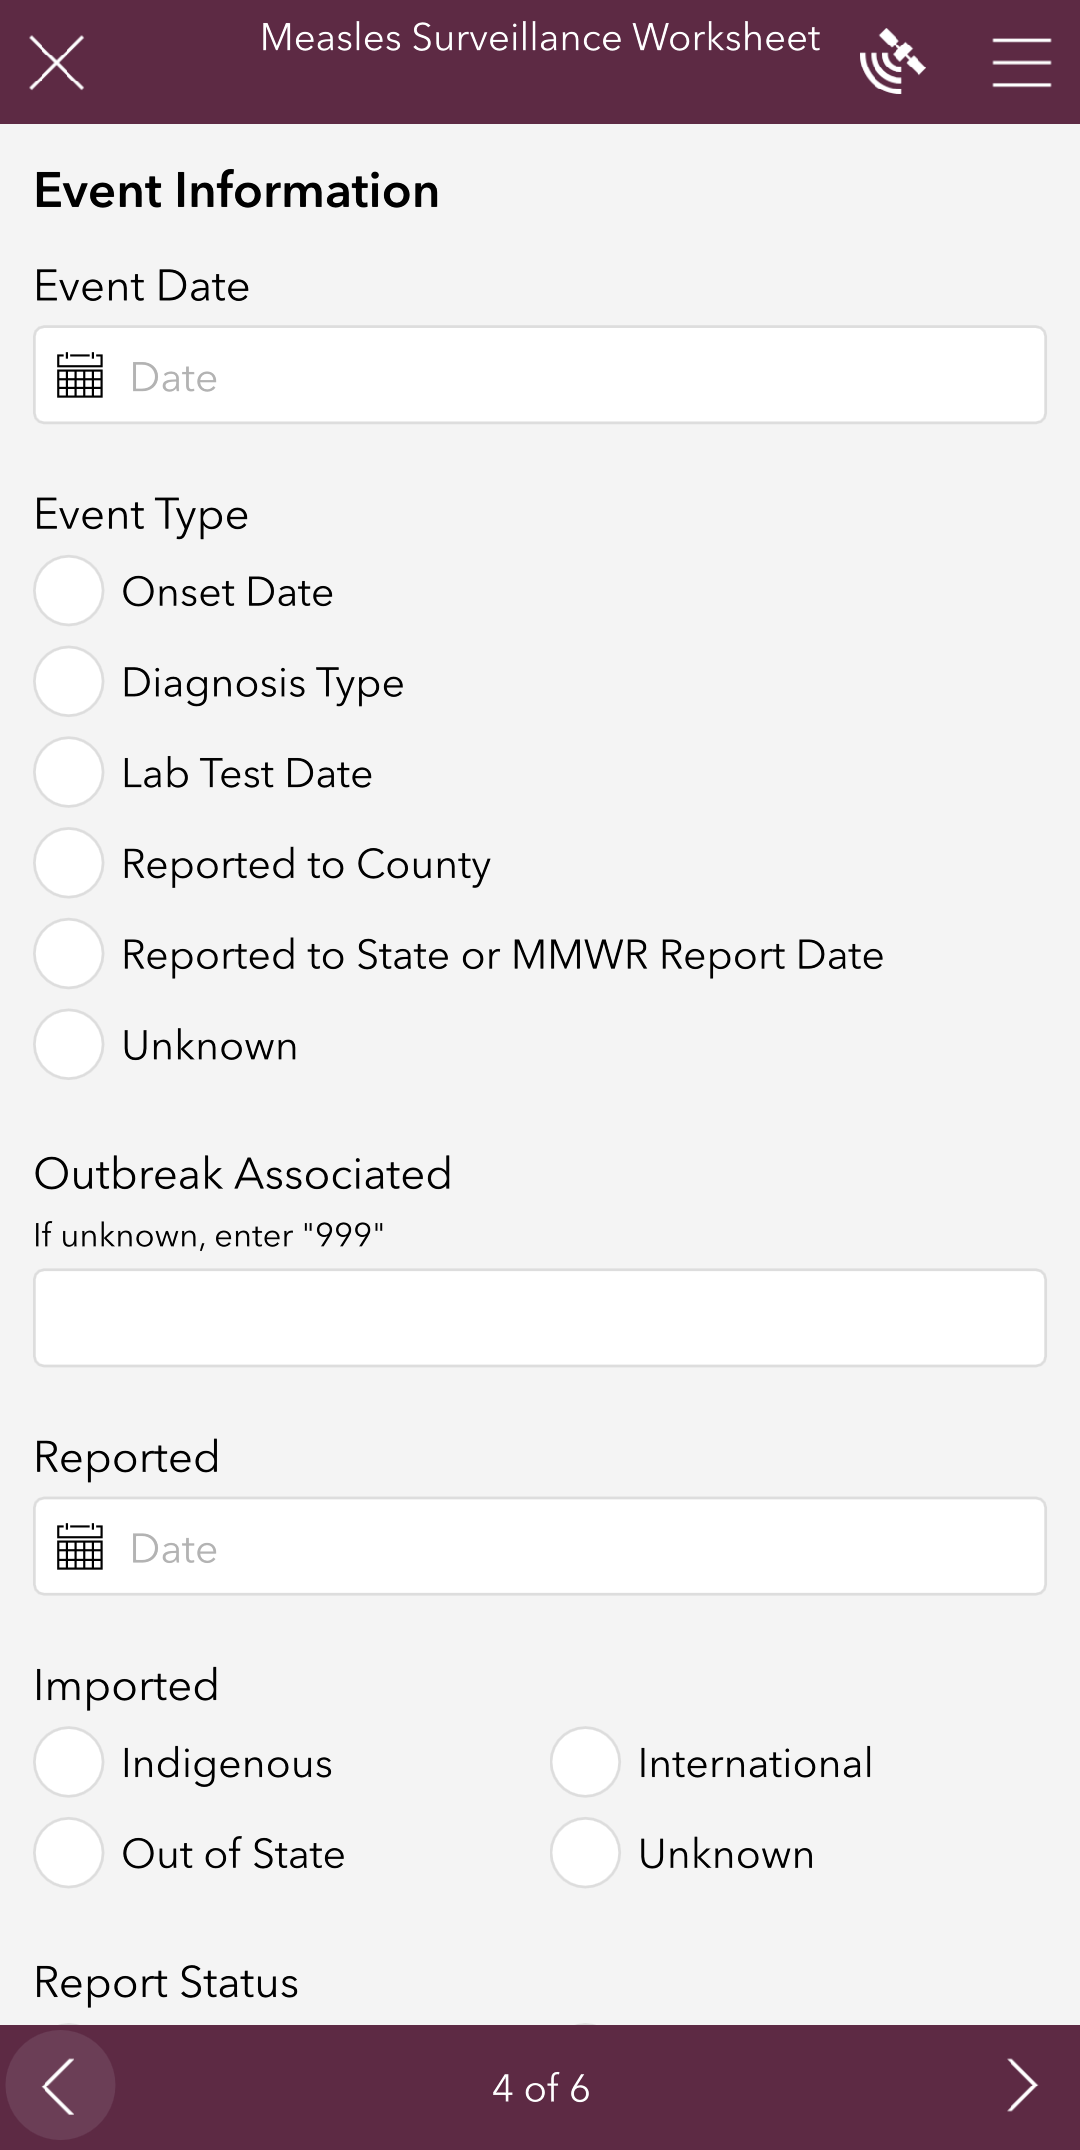
- The repeat setting is used to allow multiple answers to the same question on a single survey, as in the “Date(s) Seen by Physician” question.
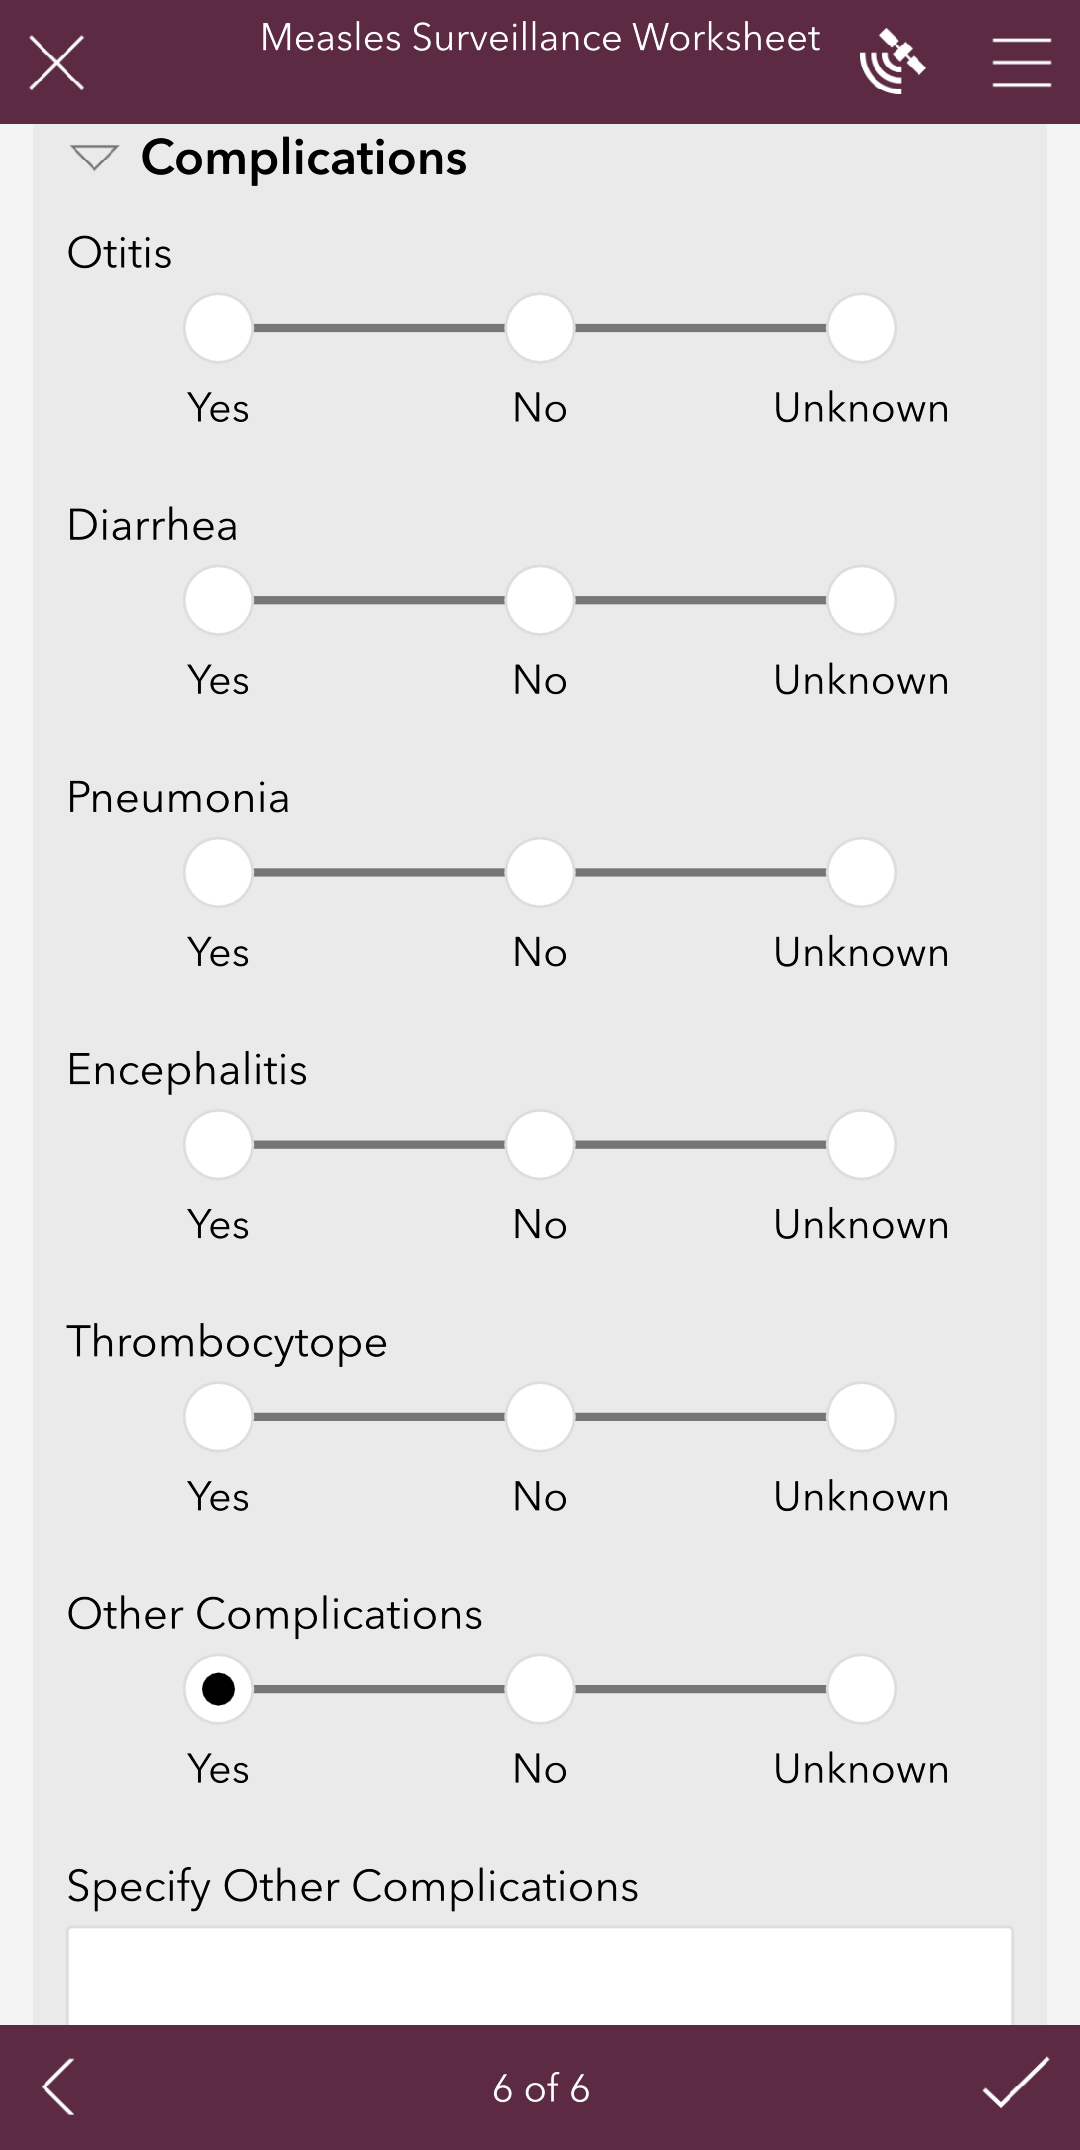
- Questions can be set with skip logic, to either appear or be skipped contingent on how a preceding question is answered. If “yes” is selected for the “Other Complications” question, the user is presented with the question “Specify Other Complications” where s/he can enter text.
- The survey has been visually organized by aggregating questions into pages and by placing questions into groups that can be collapsed and expanded, as with “Complications.”
 |
 |
 |
 |
 |
 |
The location can be collected either by using the device’s GPS location, or by searching for and selecting an address on the customizable, interactive map. Survey123 even supports using multiple languages, allowing the user to choose in which language to collect the survey. The information can now be collected quickly and easily on a mobile device even when offline, and the data is stored and secured. We were able to create this survey in a matter of hours.
Taking Data Further
Another advantage of using Survey123 is that all data collected are then part of your ArcGIS Enterprise Portal or your ArcGIS Online Organization, opening up countless possibilities: advanced permission mechanisms to share within the organization and publicly; data visualization options to identify spatial patterns; interactive symbology and views to emphasize patterns; powerful analytical tools to further explore data and discover relationships; access to authoritative content such as demographic and geopolitical data to enhance data and help predict trends; and dashboards to display key metrics and showcase data of particular interest to decision makers.
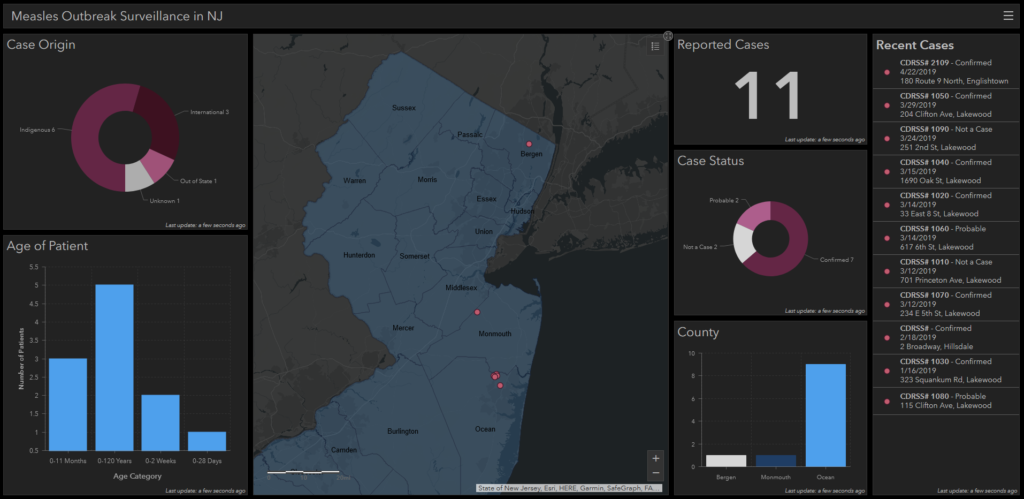
Using the demo data collected using our Measles Surveillance Survey, we created an Operational Dashboard to display data aggregated by jurisdiction a map as well as real-time graphs, charts, and other KPIs. Overall, it took less than 1 day to create this dashboard.
We have all seen the power of data once it’s put on a map, especially recently with the multitude of COVID-19 interactive maps and tracking websites out there currently. It’s easy to get there if you begin with collecting data using Survey123. Go get started!!
*Please note that even though we used publicly available data/info, this is simply a demonstration use case and is not real.