Highlighting policing transparency
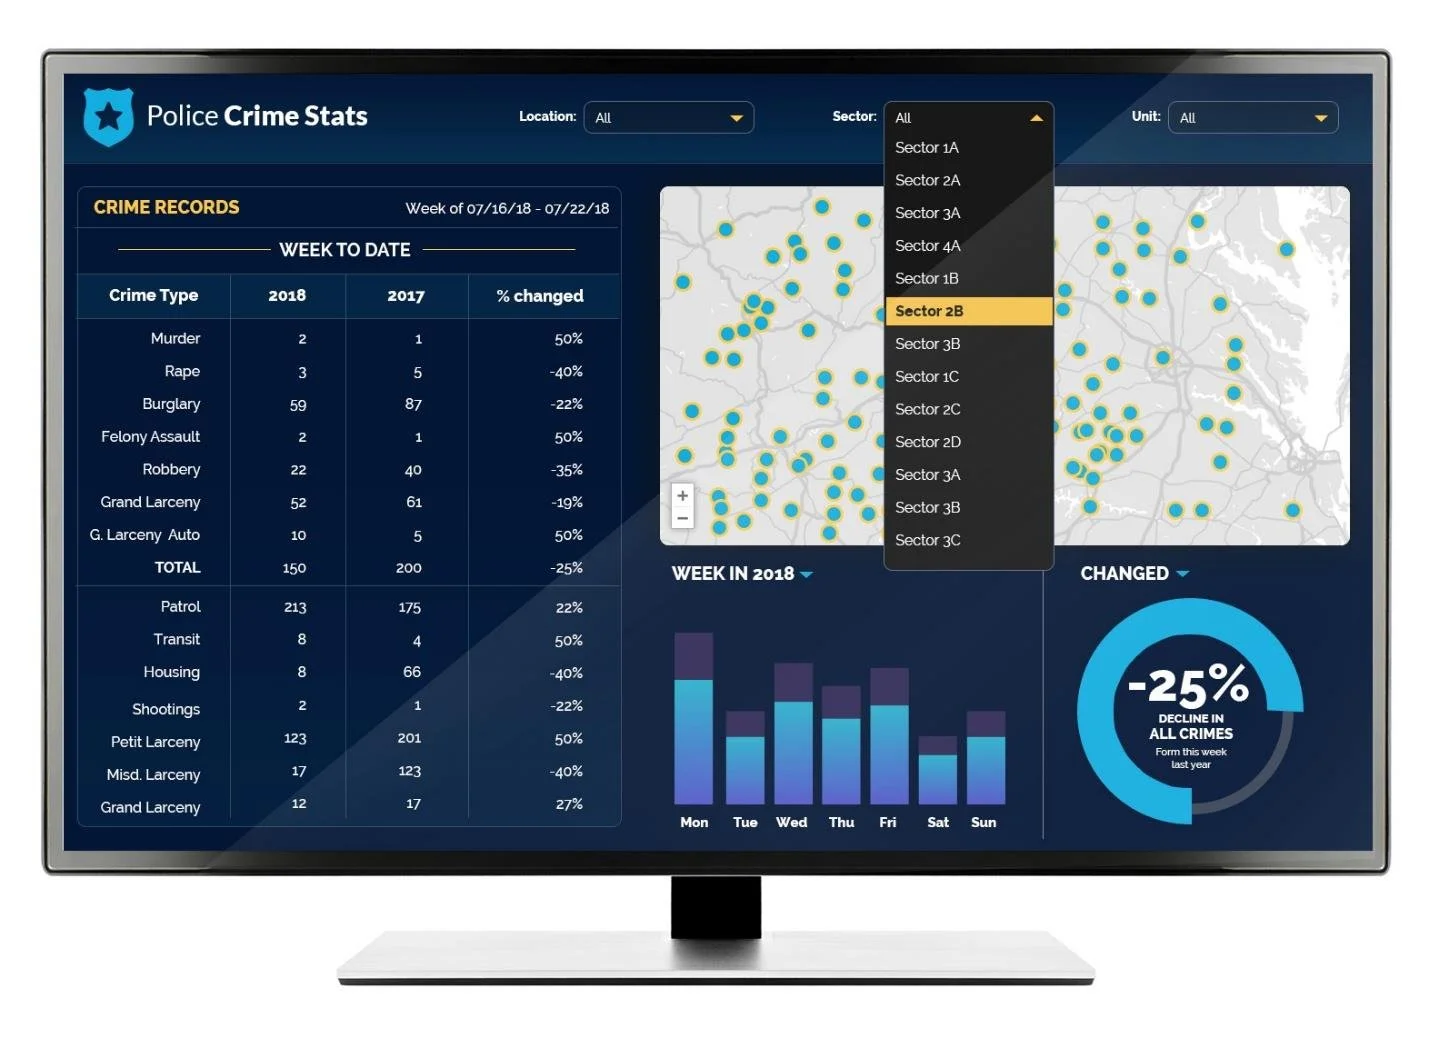
Introducing Police Crime Stats – a website to visualize and analyze crime statistics to support community-led policing
*Please note this project is highly confidential in nature. Modifications to designs have been applied to respect the confidentiality of this customer.
Assignment
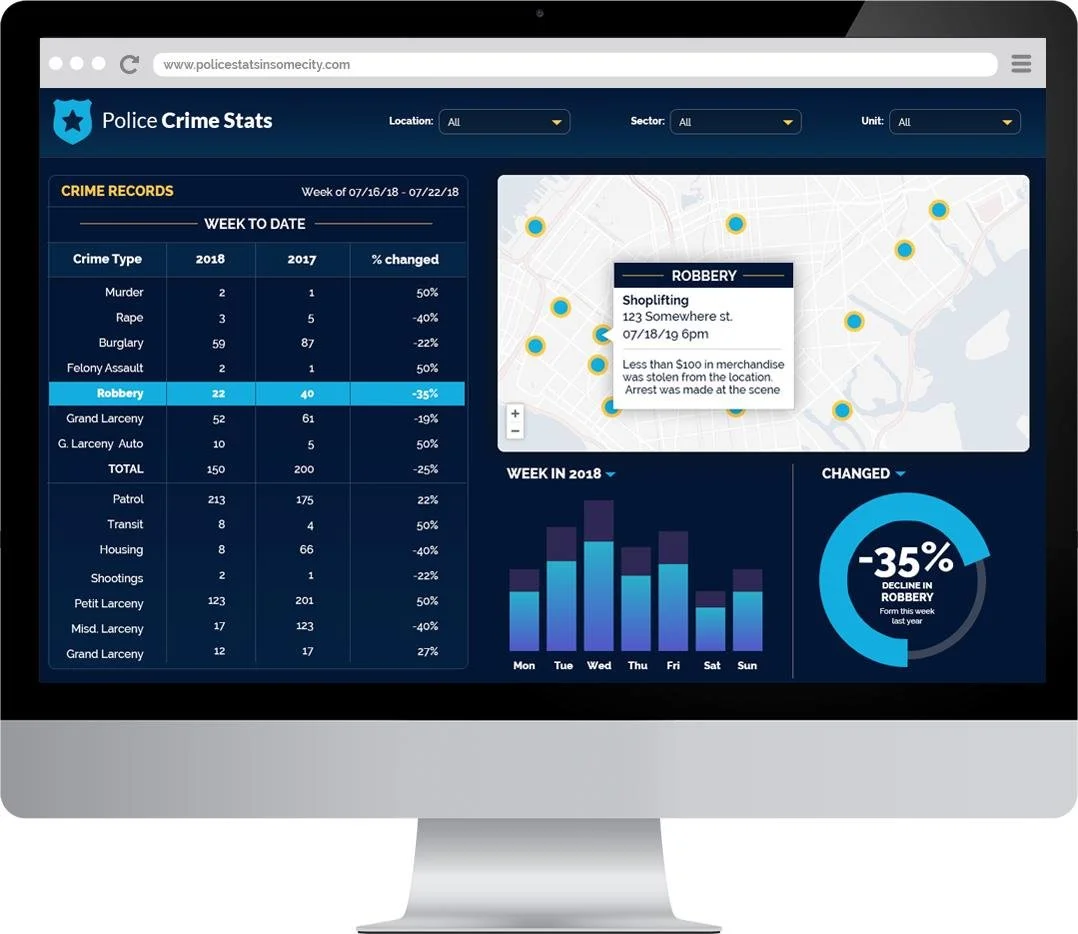
The assignment was to build a public-facing web portal where the community could view the crime statistics in their metropolitan area based on various data points. The site was designed to facilitate open communication with the public and highlight crime trends in a simple and visually appealing manner.
Approach
Our approach was to focus on the needs of the community as well as the customer requirements to deliver a product that was intuitive, highly informative, easy to understand, and visually stunning. We did so by diving into the available data, doing in-depth research, and combining that with data visualization best practices.
Results
The result was a web application that is easily accessible, intuitive, and provides the required information to the community. This is a project that we are quite proud of. The end results gave the public a clearer and broader picture of crimes in their community.
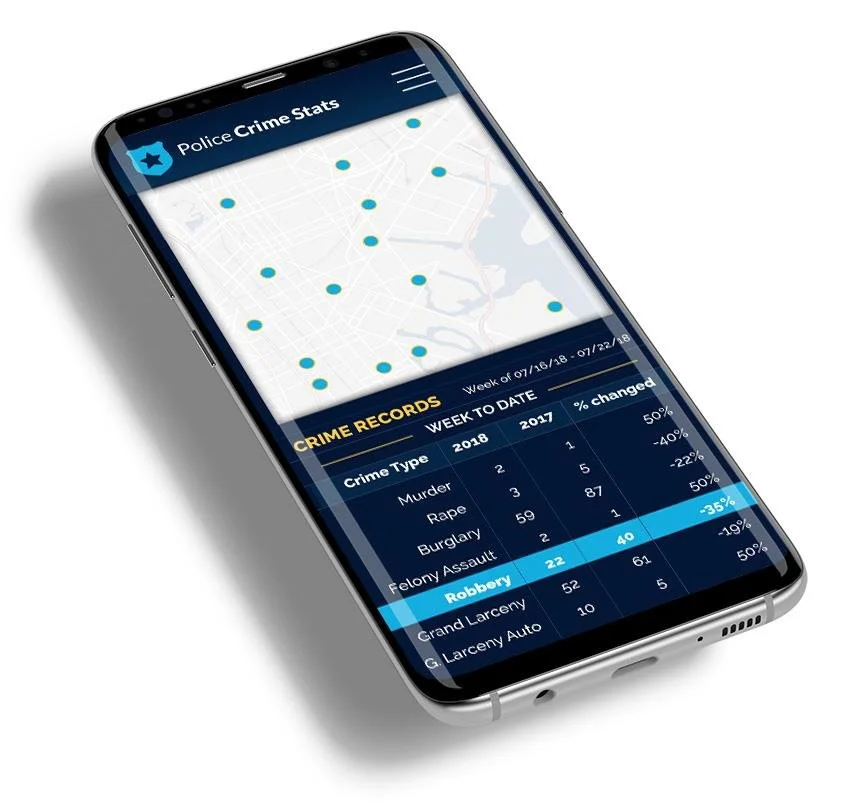
Crime Stats mobile: Clean and clear at all sizes and platforms
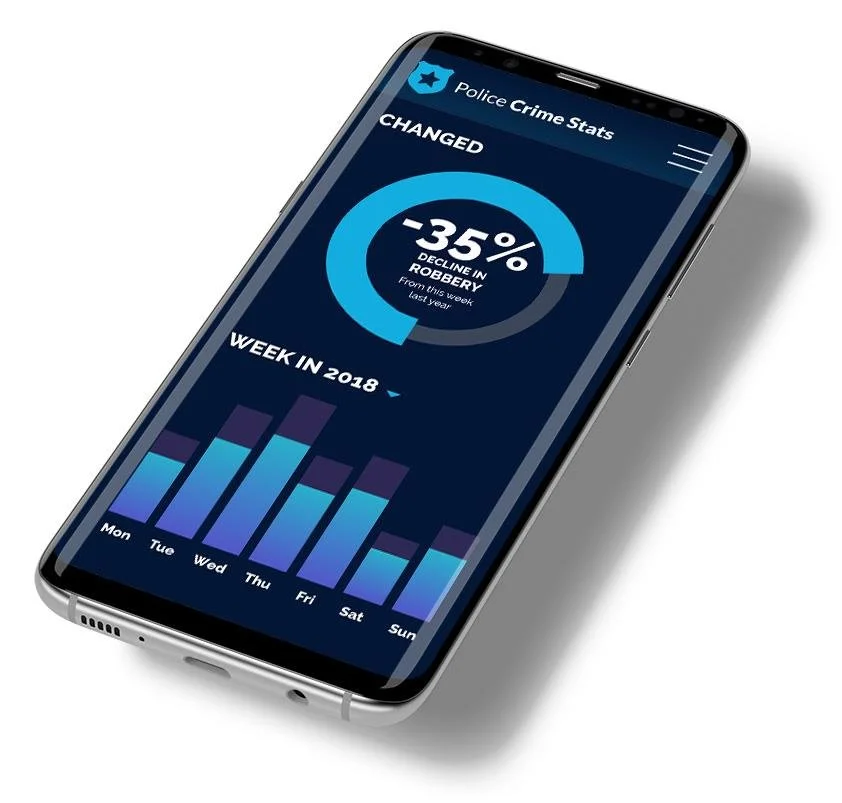
Crime Stats mobile: Animated graphical interface that brings live to the statistics
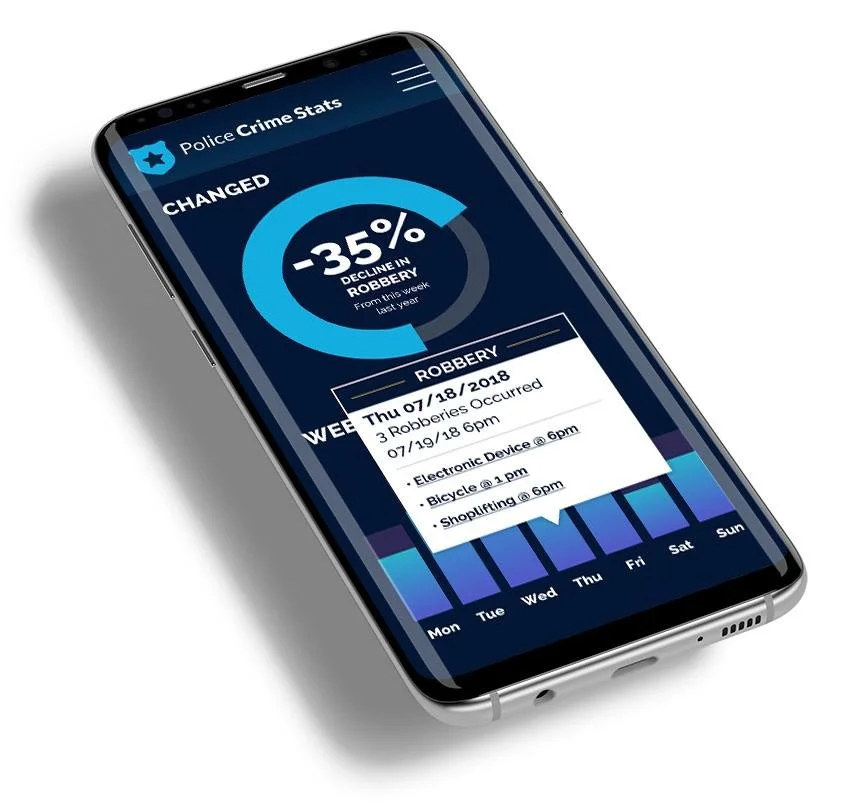
Crime Stats mobile: Intuitive delivery of vital information
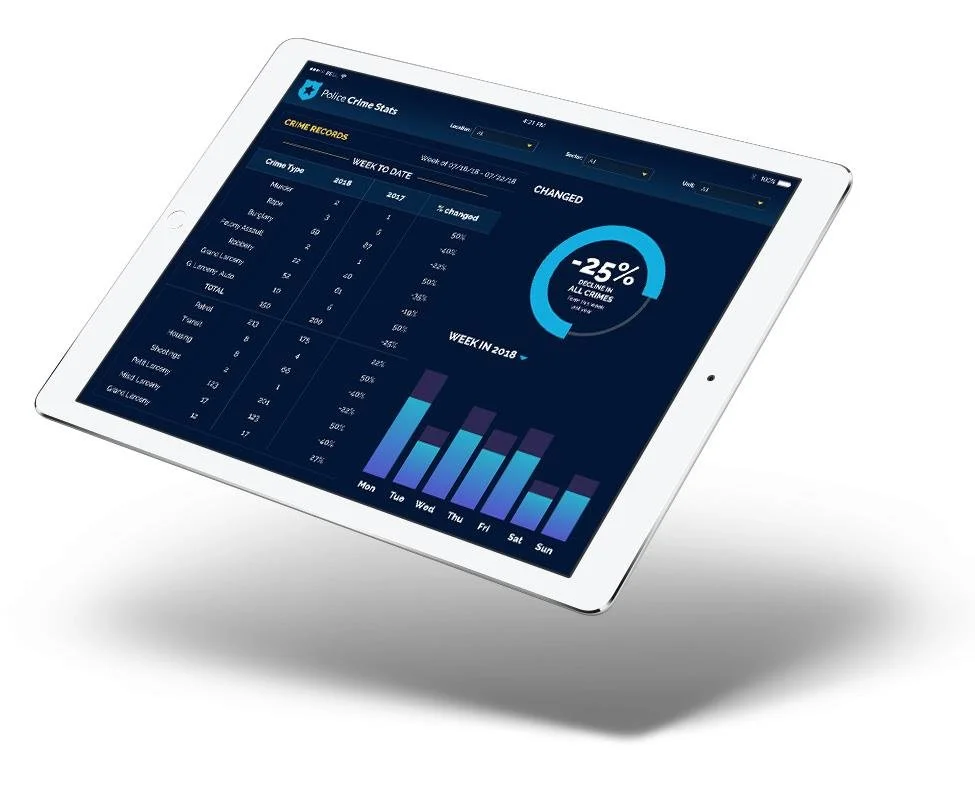
Crime Stats Responsive Tablet: Stunning and functioning seamlessly on all platforms